Memory tracing retrospective
On the dawn of computer era, every allocated piece of memory was properly accounted by a programmer, it was not possible otherwise as memory was limited and precious fundamental resource. Memory is no less fundamental resource nowadays but with its exponential growth per single machine; trend of adding more high level memory management abstractions bloomed. In languages like C it’s rather easy to calculate exact amount of memory allocated (you fully control all heap allocation by yourself), on the other hand it’s not that simple in languages like Go that are hiding memory management details inside runtime abstractions. Nevertheless, there is a chunk of use cases where you absolutely have to have a notion of allocated memory for your application. Then if you know your memory allocations, you can define memory quotas for the whole process or even memory budgets for specific operations (which could be extremely useful in application like databases, complex parsers, etc.) There are also goto list of popular answers for memory tracing in go:
-
you can use MemStats output to control memory consumption of the whole process, but it doesn’t provide enough granularity and could be too fuzzy to use.
-
you can use OS (including any imaginable virtualization solutions) tools directly to achieve same effect as above; though problems are the same: poor granularity and fuzziness.
-
to gain full control you can write somewhat a custom memory allocator and garbage collector by yourself; for e.g. TiDB has chunk and tracker that are used to allocate and track meaningful chunks of resources in TiDB per query, another example is Couchbase go-slab allocator, etc.; this is a great approach but still it has downsides - it’s not go native which means builtin structures are not traced at all thus they should be avoided in critical places; it’s tailored to specific use case or even code base and demands a lot of efforts to port and adopt it properly into other code bases.
-
you can calculate each allocated object size by your self; good example is dgraph that opened an issue in which they have problems to accurately meassure objects size using creachadair/misctools/sizeof; in conclusion it’s good method for quick estimation in my opinion although it lacks precision and requires lots of boilerplate code to measure size of each object.
All methods described above are doing great job for certain situations, but you might ask is there any universal single solution that can be easily plugged to existing go code base be precise enough and provide good granularity? Ideally we want to have simple yet convenient interface for memory allocation tracing enabled by default for any generic purpose go code.
Introduction of gotcha library
Meet gotcha package that seamlessly patches go runtime to provide a convenient way to track amount of heap allocated bytes, objects, calls per goroutine.
package main

import (
	"context"
	"fmt"

	"github.com/1pkg/gotcha"
)

func main() {
	var v []int
	gotcha.Trace(context.Background(), func(ctx gotcha.Context) {
		v = make([]int, 100)
		b, o, c := ctx.Used() // bytes objects calls
		fmt.Println("initial allocation", b, o, c) // will print "initial allocation 824 101 2"
		gotcha.Trace(ctx, func(ctx gotcha.Context) {
			v = make([]int, 5000)
			b, o, c := ctx.Used() // bytes objects calls
			fmt.Println("derived allocation", b, o, c) // will print "derived allocation 40024 5001 2"
		})
		select {
		case <-ctx.Done():
			b, o, c := ctx.Used() // bytes objects calls
			fmt.Println("total allocations", b, o, c) // will print "total allocations 41840 5116 15"
		default:
			panic("unreachable")
		}
	}, gotcha.ContextWithLimitBytes(gotcha.KiB)) // set context allocation limit to one kilobit
	// note that prints above might be slightly different on your machine
	fmt.Println(len(v)) // 5000
}
Gotcha exposes single function Trace that tracks memory allocations for provided Tracer function. All traced allocation results then are added to the single context parameter of this Tracer function. This way context is seamlessly staying updated and tracking all memory allocations happened in current function scope.
Gotcha context fully implements context.Context interface and could be used to cancel execution if provided memory limits were exceeded. Gotcha supports nested tracing by providing gotcha context as parent context for derived Tracer function; then gotcha tracing context methods will also target parent context as well as derived context.
It’s important to say that gotcha is not trying to measure momentary memory usage which involves GC tracing into the act, keeping track on GC is rather a big task on it’s own and out of scope for gotcha. Instead gotcha traces all memory allocated in monotonic increasing fashion where is only allocations are taken into consideration and all deallocations are discarded.
How does gotcha even work?
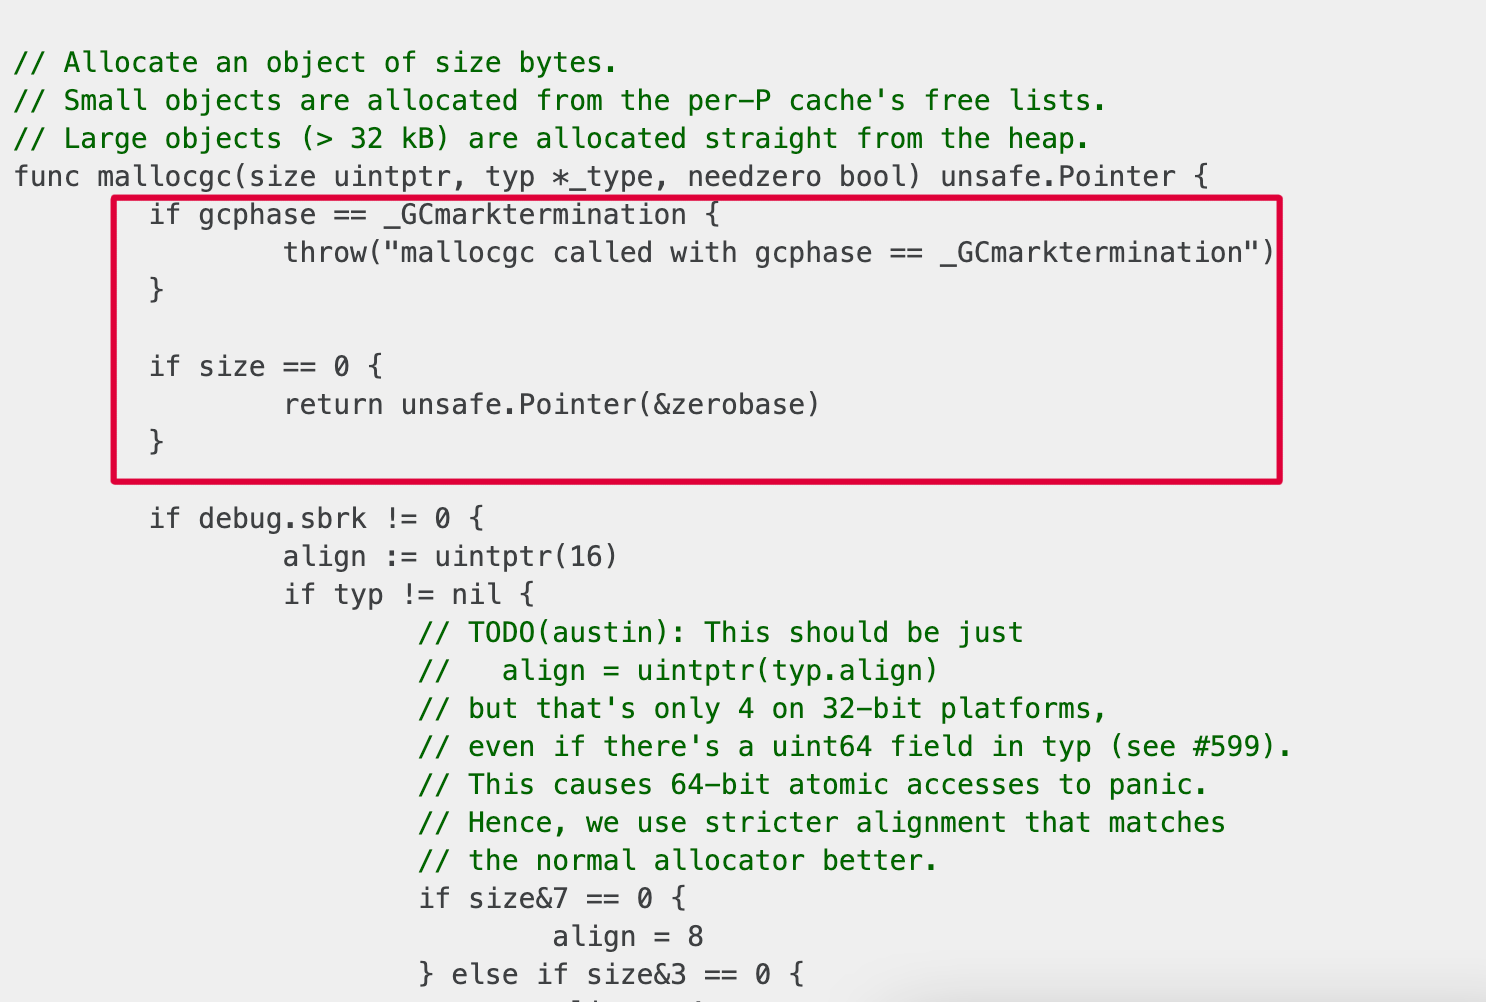
In order to understand what we need to do, we need understand how go runtime allocates memory in first place. After some reading inside go runtime we can find next definition file.
// Allocate an object of size bytes.
// Small objects are allocated from the per-P cache's free lists.
// Large objects (> 32 kB) are allocated straight from the heap.
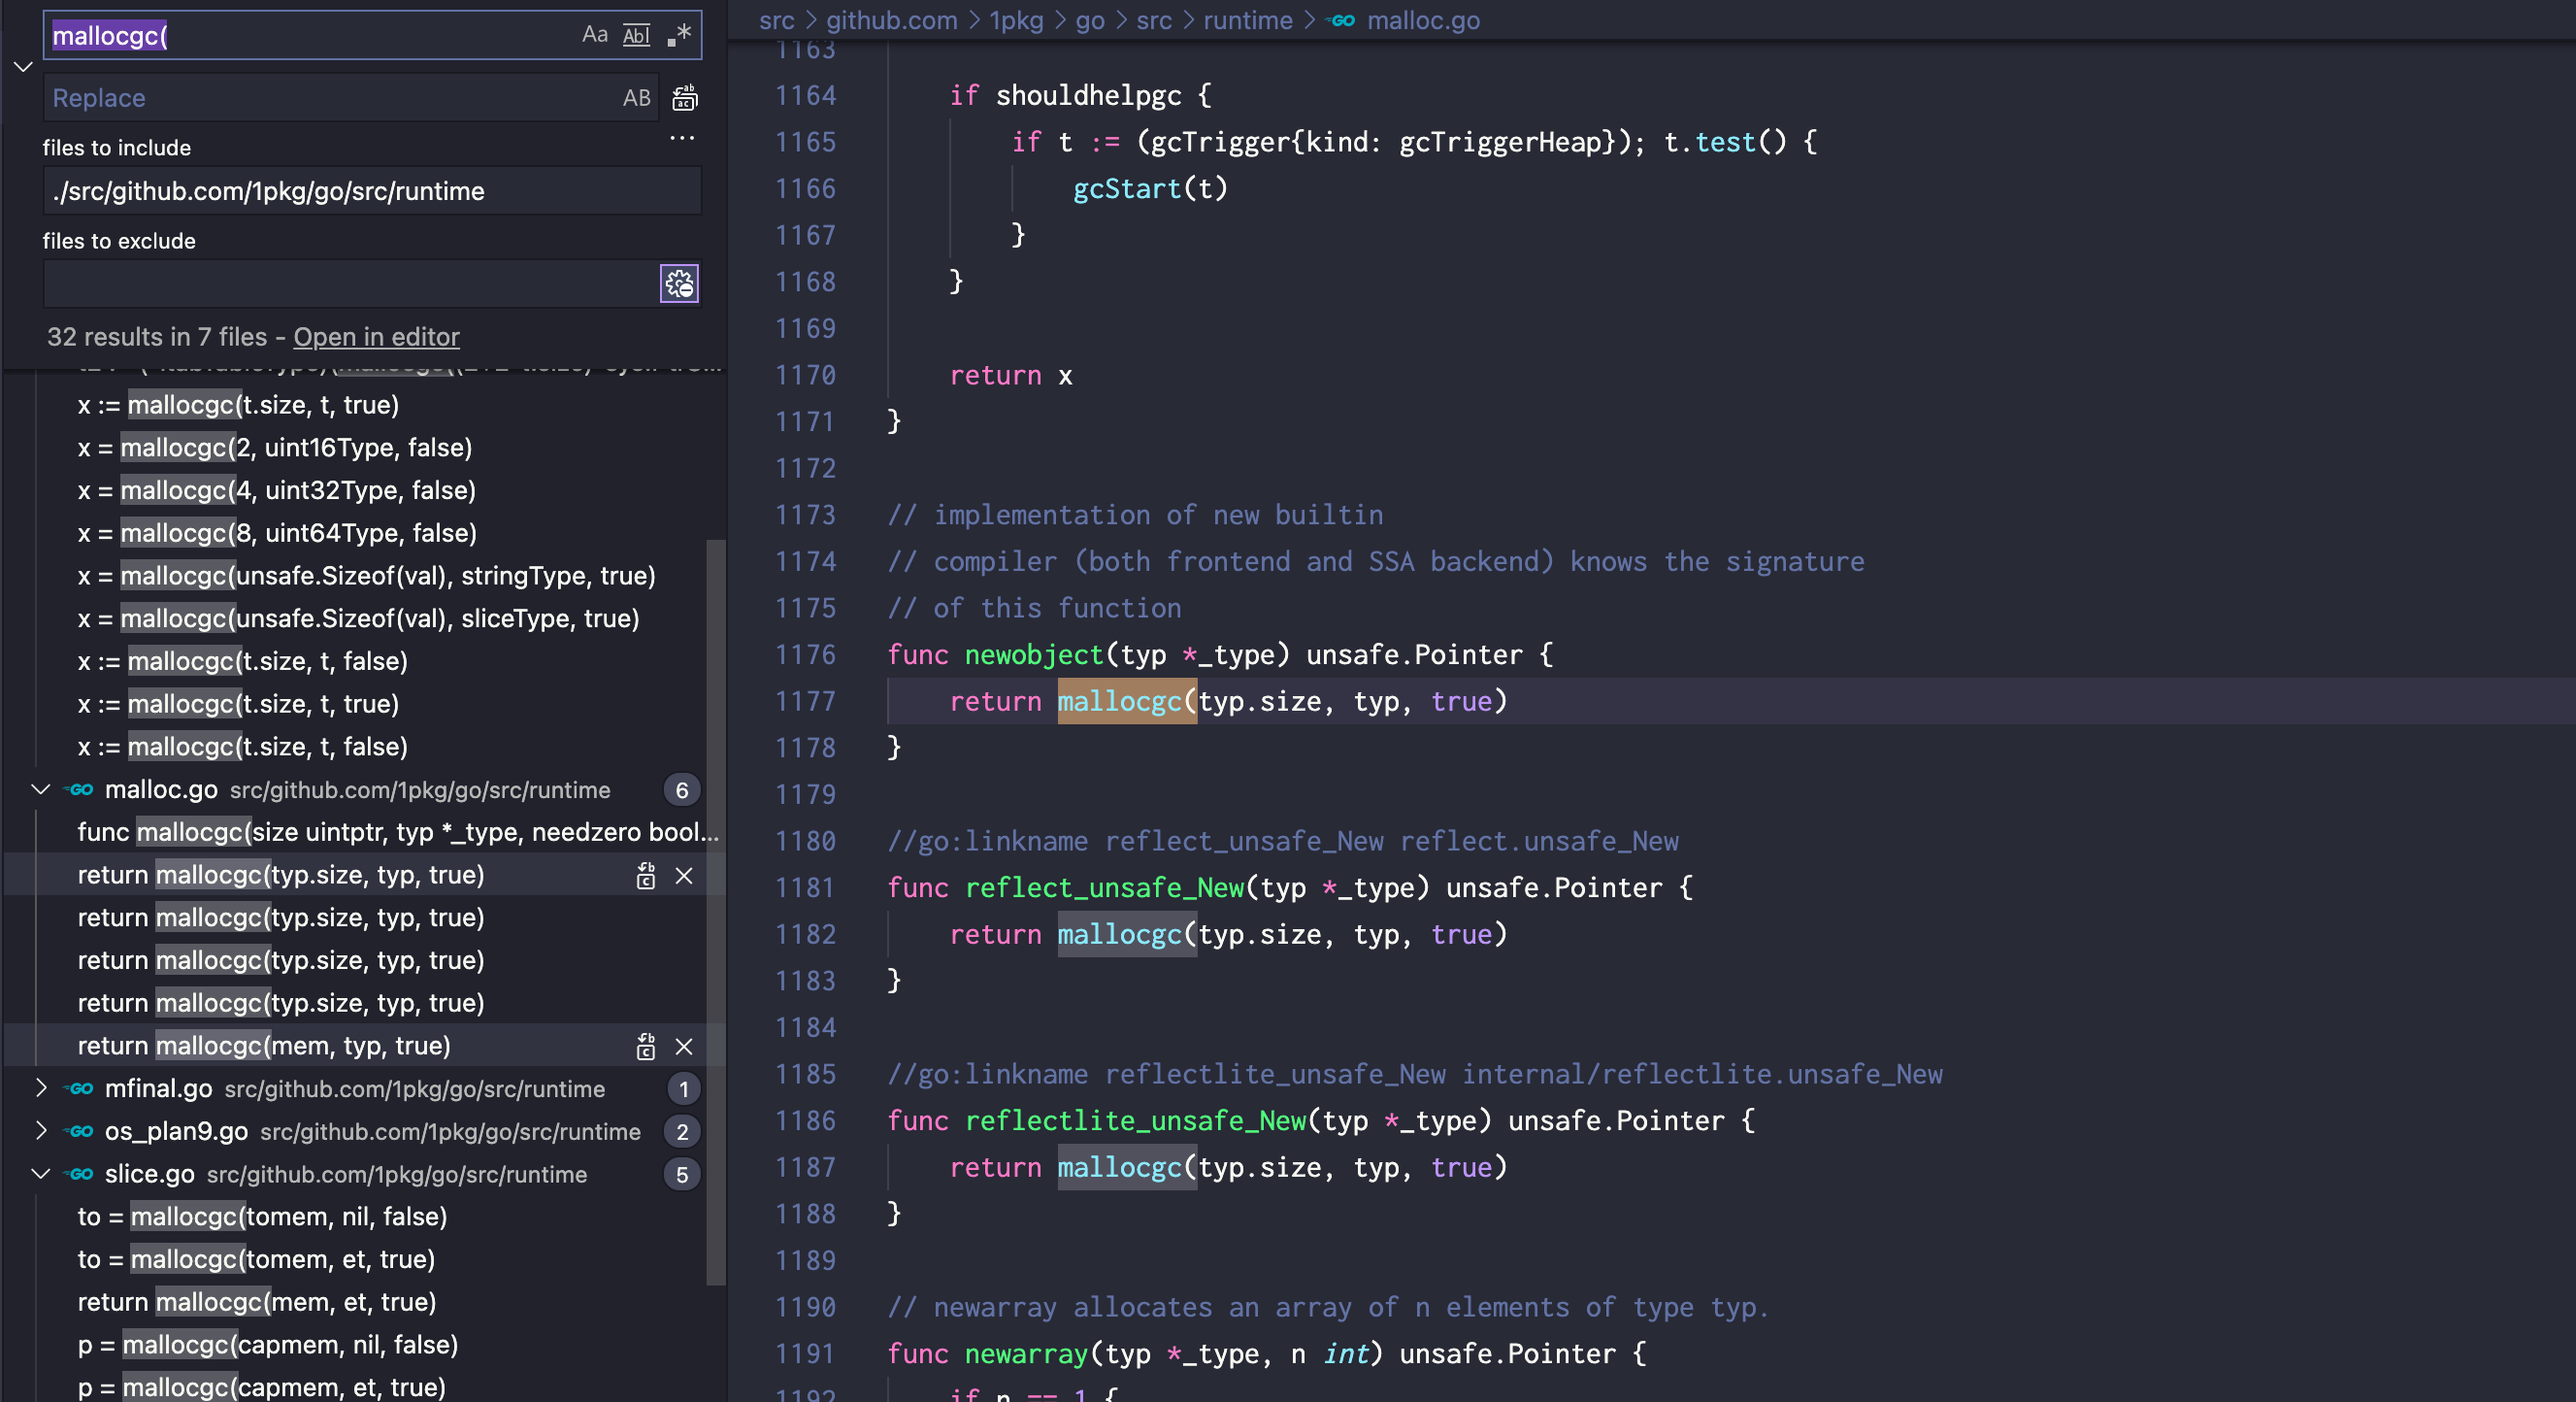
func mallocgc(size uintptr, typ *_type, needzero bool) unsafe.Pointer
This is the single most important entrypoint for managed heap memory allocations in go. All possible allocations for objects, arrays, strings, slice, map, etc. will use this function to allocate memory required for them. As always there are numbers of exceptions to the mallocgc: direct malloc calls, etc. but for simplicity we won’t consider them meaningful for us.
So in theory we just need to hook to mallocgc function with our custom code that collects number of allocated objects, bytes, calls - profit. What seems like a simple idea rather requires not trivial implementation in go, apart from security concerns (messing with go allocator), there are dozens of implementation problems too: mallocgc is internal go runtime function not exposed to the world, even if mallocgc would have been exported - mallocgc is a function that simply allocates an object of n bytes and doesn’t provide neither any way to trace this nor hook callback nor sort of allocation events. Then even if we have patched tracing mallocgc function we need to have an ability to track allocation per goroutine which is tricky because go doesn’t provide any simple way to uniquely identify goroutines whatsoever.
Unexported function - go:linkname to rescue
Need of exporting unexported function in go is not new. There is a great article on searching ways how to do it link. Briefly, it’s possible to export any internal function using //go:linkname compiler directive. From the godoc:
//go:linkname localname [importpath.name]

This special directive does not apply to the Go code that follows it.
Instead, the //go:linkname directive instructs the compiler to use
“importpath.name” as the object file symbol name for the variable or function
declared as “localname” in the source code. If the “importpath.name” argument is omitted,
the directive uses the symbol's default object file symbol name and only has
the effect of making the symbol accessible to other packages.
Because this directive can subvert the type system and package modularity,
it is only enabled in files that have imported "unsafe".
Okay great, so using next function definition with go:linkname compiler directive in our local package will do the trick - links internal mallocgc function body from runtime package to our local function definition.
// tp from `runtime._type`
type tp struct {
	size uintptr
}

//go:linkname mallocgc runtime.mallocgc
func mallocgc(size uintptr, tp *tp, needzero bool) unsafe.Pointer
Note how we defined our custom tp type replacement for runtime._type. We don’t need to have a full copy of fields from runtime._type only fields that we will use and memory paddings between. It comes from the fact that mallocgc accepts a pointer to the type which makes both *tp and *runtime._type to be intercompatible with each other.
Logically go:linkname could be used not only for accessing existing function implementation but also for linking the implementation to the function name. This is probably the main reason why go:linkname exists in first place, by using it for example you can link the go function definition facade to some native code implementation. Which means that if we could hope for some smart linker behavior (like last go:linkname should win the linking) we then can redefine mallocgc function implementation directly, or even better link original mallocgc body to temporary function to keep allocation code untouched and then redefine mallocgc to hook allocations tracing.
// tp from `runtime._type`
type tp struct {
	size uintptr
}

//go:linkname mallocgcOrigin runtime.mallocgc
func mallocgcOrigin(size uintptr, tp *tp, needzero bool) unsafe.Pointer

//go:linkname mallocgc runtime.mallocgc
func mallocgc(size uintptr, tp *tp, needzero bool) unsafe.Pointer {
  // trace allocations here
  // allocBytes += size
  // allocObjects += size / tp.size
  // allocCount += 1
  return mallocgcOrigin(size)
}
Unfortunately go linker doesn’t have any sort of heuristics and simply doesn’t allow to link multiple bodies to single function name, which results in error similar to duplicate symbol runtime.mallocgc. So we need to find a different way how to hook memory allocations tracing to mallocgc.
Allocation hooking - code patching to rescue
As it was said before go runtime doesn’t expose any simple way how to hook to mallocgc. The only way to hook memory allocations tracing to mallocgc is to override mallocgc in next fashion.
//go:linkname mallocgc runtime.mallocgc
func mallocgc(size uintptr, tp *tp, needzero bool) unsafe.Pointer {
  // trace allocations here
  // allocBytes += size
  // allocObjects += size / tp.size
  // allocCount += 1
  return mallocgcOrigin(size)
}
The patch above is trivial with dynamic interpreter languages like python or javascript. Where function represented in some form of objects with additional meta data attached to them and their body executed on the call. In such environments it’s fairly easy to substitute function implementations. On the other hand go is compiled language which means all function code is compiled to machine code and then machine code is executed. This definitely restricts possibilities of patching code on the fly although it doesn’t kill possibilities entirely.
Again this is not the first time when go code patching is required, so bouk/monkey was developed long ago article. Basically, this library does really simple thing; it replaces the start of original function body with machine code jump instruction to target patch body instead, which is exactly what we need.
Code patching in depth naive approach
As a side affect of bouk/monkey usage body of original function become completely lost because of unconditional jump instruction replacement. This is problematic for our tracing because now we can trace allocations but original allocation mallocgc code itself is gone. Okay not a huge problem we can copy paste original go mallocgc implementation from runtime package to our local mallocgcOrigin and live with this, right? Not really, there are multiple problems with that:
mallocgcdepends on numbers of different internal runtime functions which needs to be referenced bygo:linknameor copied as well.- any future internal
mallocgccode update will make our localmallocgcpatch inaccurate. mallocgcinconsistency with previous go runtime versions, problem is the same as the problem above but integrated over the time; what should be done for previous runtime versions, should accuratemallocgccode be copied for each possible go version? meh …
Code patching in depth semi naive approach
Okay, if we can’t patch mallocgc function directly let’s search for all its usage inside go runtime code.
 Not bad we need to patch 20+ functions instead of one now 😿. But if you look closely a lot of those functions are either direct call to
 mallocgc which is trivial to patch or functions that probably are not even 100% important to patch like interface.conv family that is used for allocations for code like vt, ok := var.(type). Sure there are some bigger functions over there (makeslice, growslice, etc.) too that could be either fully replaced see, ignored, or patched with bouk/monkey patch guard.
bouk/monkey patch guard is basically the way how to call original function from the patch, the idea is pretty straightforward instead of just replacing original function code with unconditional jump bouk/monkey - save original bytes before the replacing. Then by calling unpatch on the guard function body of patched function is restored back to original for current function call and then patched back with deferred restore call on the guard.
var gmakeSlice *monkey.PatchGuard
gmakeSlice = monkey.Patch(makeslice, func(tp *tp, len, cap int) unsafe.Pointer {
  gmakeSlice.Unpatch()
  defer gmakeSlice.Restore()
  // trace allocations here
  // allocBytes += tp.size * len
  // allocObjects += tp.size
  // allocCount += 1
  return makeslice(tp, len, cap)
})
This approach is great why not use it for mallocgc directly? Well in fact it doesn’t work; underneath bouk/monkey patch guard has allocations that cause infinite loop on unpatch call. But here comes more: it’s unsafe to use the guard because it’s not thread safe, while function is unpatched back to original mallocgc code another allocation call could happen.
Code patching in depth fighting to the end
The problem is obvious we need to patch mallocgc permanently while still have access to original mallocgc. Modifying bouk/monkey patch guard we can try remove all excess allocations and keep just bytes flipping (coping) forward and backward in both unpatch and restore functions respectively. This still doesn’t solve the problem with thread safety though, meaning either synchronization of each mallocgc allocation (which is ridiculous) or drop patch solution totally and search for different ideas.
Simplest of these ideas could be to copy original function body to third independent function before patching. The problem with this approach to find original body boundaries which in machine code means finding last ret instruction. To find it we need to implement sort of custom assembly parser which will be able to parse hex machine instructions, follow all the jumps, etc.; also keep in mind that ideally this custom parser should support the same list of supported architectures as go. Sounds too complicated for the memory allocation tracing task …
monkey.Patch(makeslice, func(tp *tp, len, cap int) unsafe.Pointer {
  // trace allocations here
  // allocBytes += tp.size * len
  // allocObjects += tp.size
  // allocCount += 1
  return mallocgcHolder(tp, len, cap)
}, mallocgcHolder)
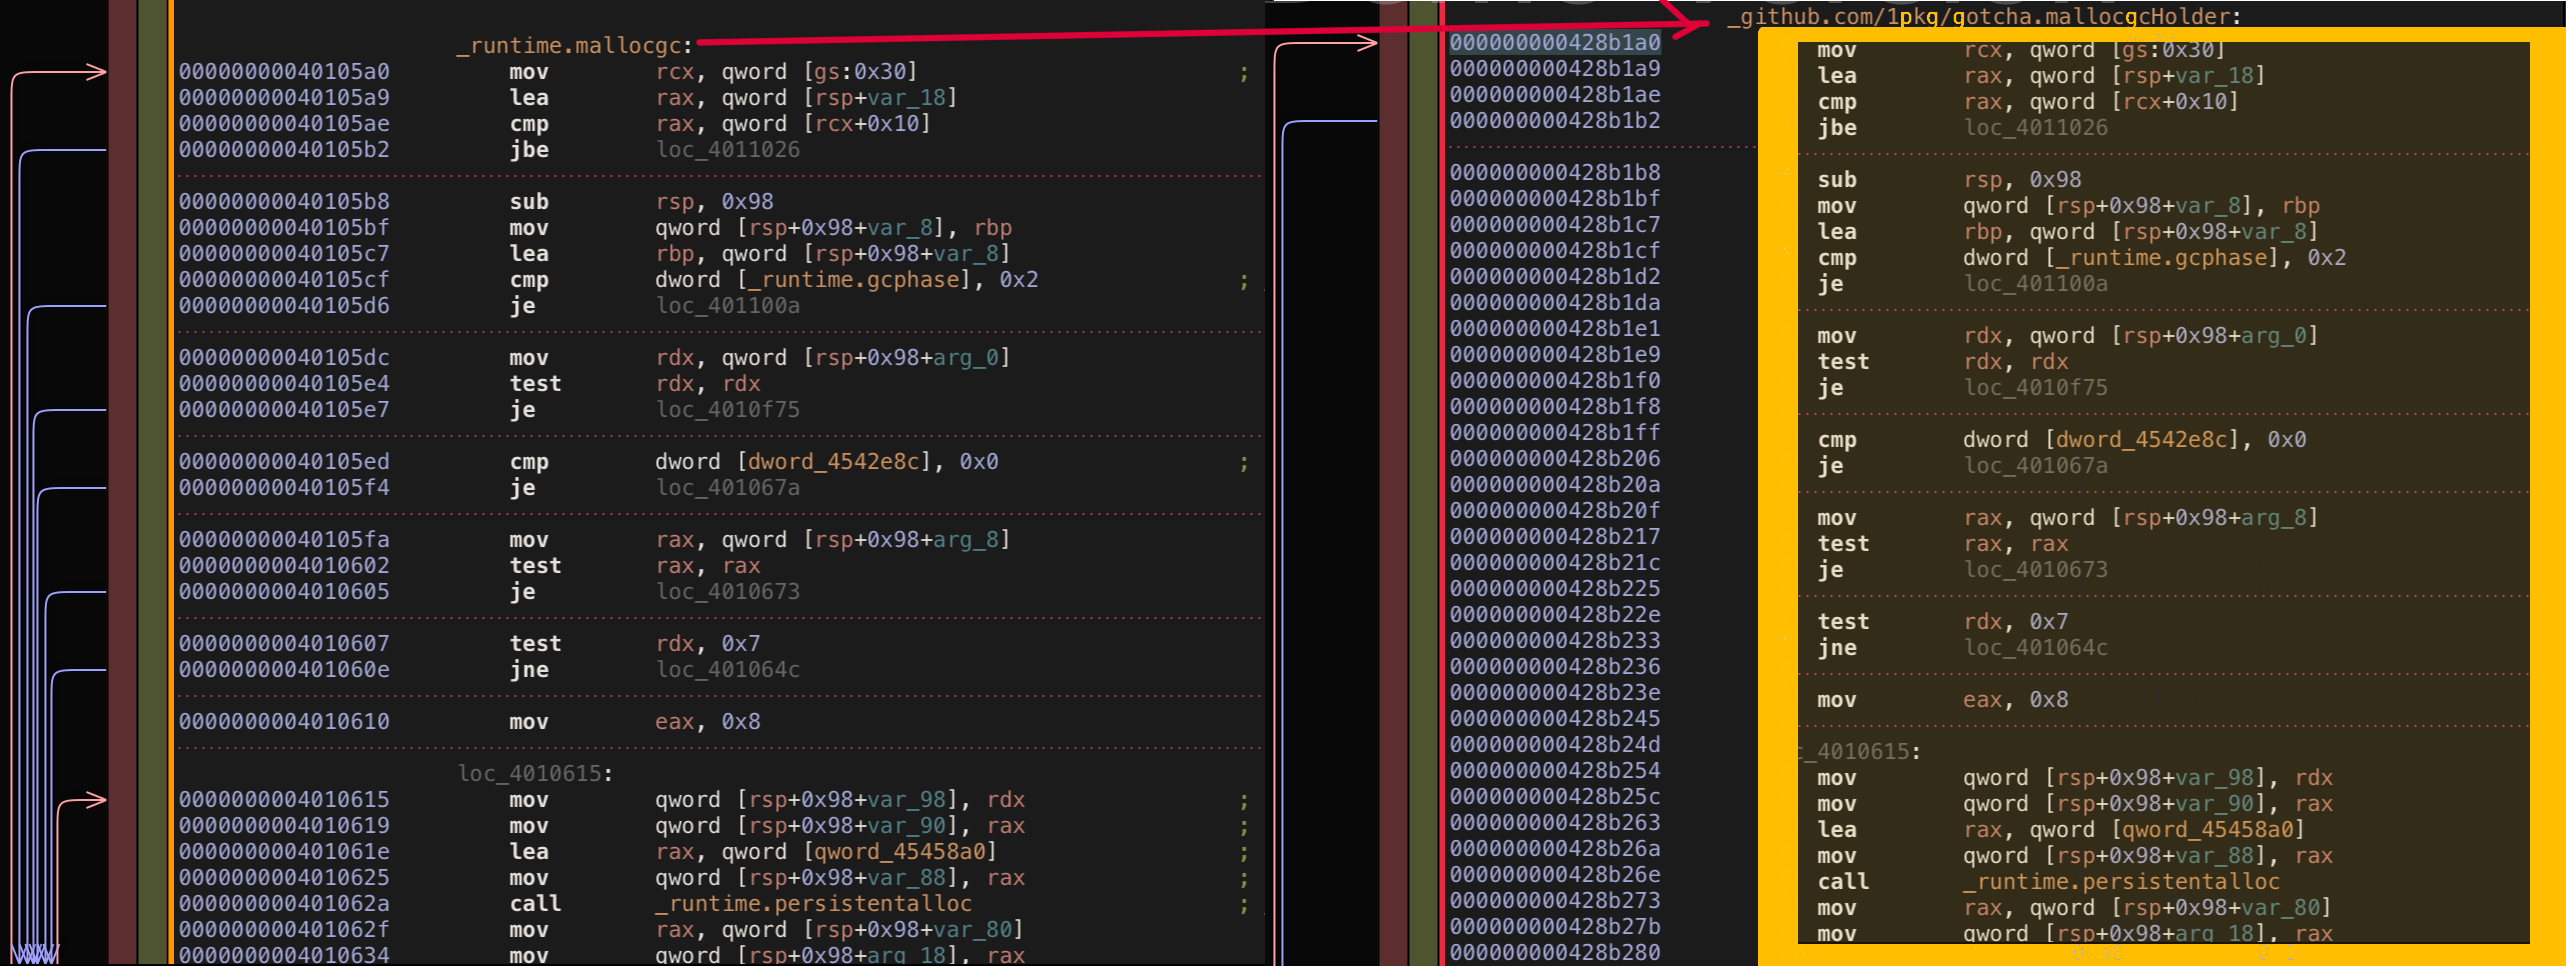
Also this approach has another interesting requirement, if as stated before we are going to use the third independent function to hold original function body, in the simplest preallocated holder implementation, should at least have the same bytes size of body as original function body has. The tricky part is: in order to get size of original body, we need to disassembly original binary, count the original bytes, and create weird holder function that reasonably covers amount of bytes needed to fit original body this holder body never will be used directly.
func mallocgcHolder(size uintptr, tp *tp, needzero bool) unsafe.Pointer {
	fmt.Println("unreachable")
	fmt.Println("unreachable")
	fmt.Println("unreachable")
	...
	...
	...
	fmt.Println("unreachable")
	fmt.Println("unreachable")
	fmt.Println("unreachable")
	return nil
}
Okay function body copying is not what we searched for, let’s try to improve existing jump implementation instead. Instead of jump replacement at the start of original body we could replace jump at the end of function body. Effectively we need to replace all existing ret instruction in original function body. With this implementation first original mallocgc function will be executed and then right after our patched decorator will be executed as well.
The problem with this idea is exactly the same as with idea before: the implementation requires to find all ret instructions which means parsing assembly. On top of this generally it’s unsafe to replace ret instruction with our custom jump instruction because instructions have different sizes. This most likely will lead to replacing other unwanted code parts, not only desirable ret in mallocgc.
Okay so we 100% know now that we can’t really deviate from jump at the start of the function. We also know that we need to execute both function bodies original and patch decorator, so just jump is not really suitable. Luckily we could try to use call instruction that does exactly what we need: jump to patch decorator, execute patch decorator, jump back to original place where it left it.
Sadly this also expectedly fails because original function body is destroyed by call replacement. By replacing instructions at the function top we are removing function stack setup logic _runtime.morestack_noctxt link, so in reallity we can’t directly patch function start. What we can try instead - find and patch a place near the top of mallocgc that has relatively “unuseful” code.
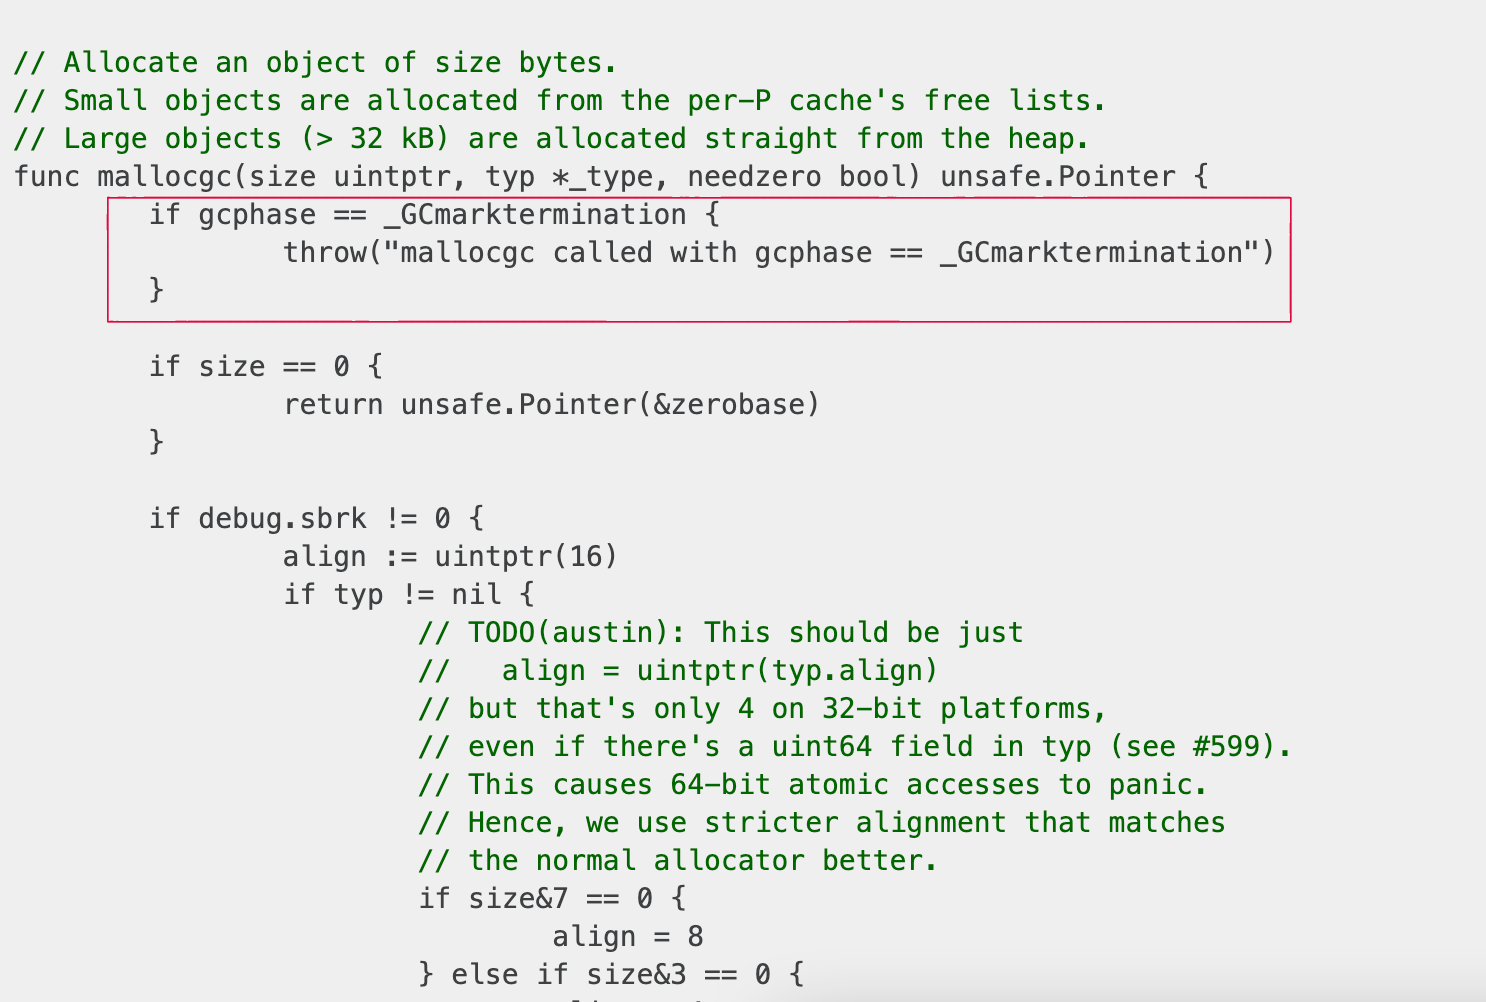
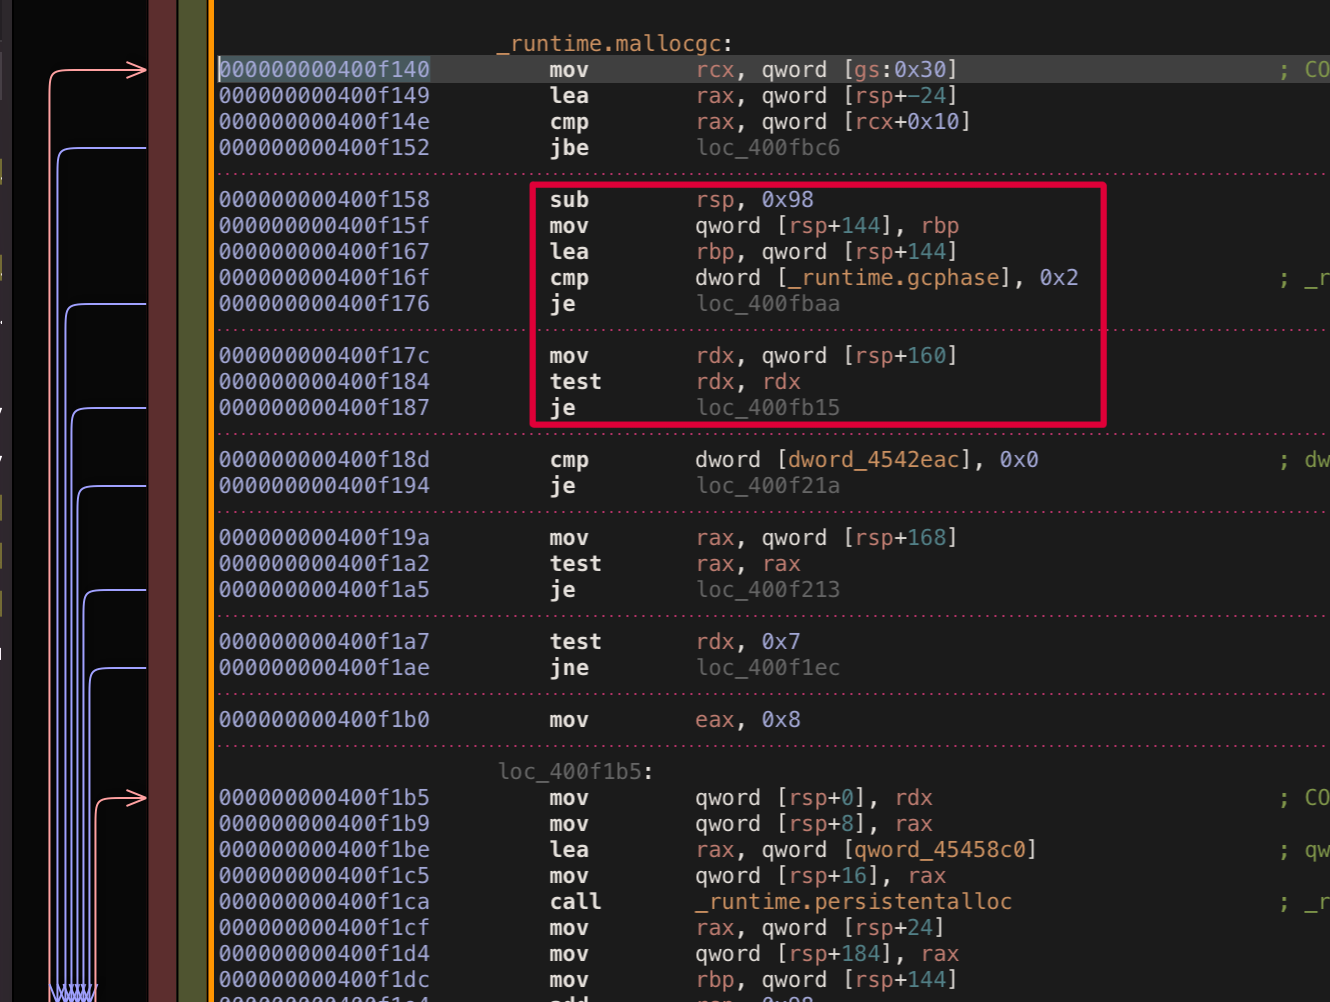
The first check that verifies GC phase invariant and throws a panic, seems not 100% important to me. Panic basically means this piece of code should be unreachable 99.99(9)% of the normal execution time and probably could be sacrificed for our higher goal 😈. Let’s take a look at mallocgc assembly one more time and calculate what bytes offset should be used to patch this exact check.
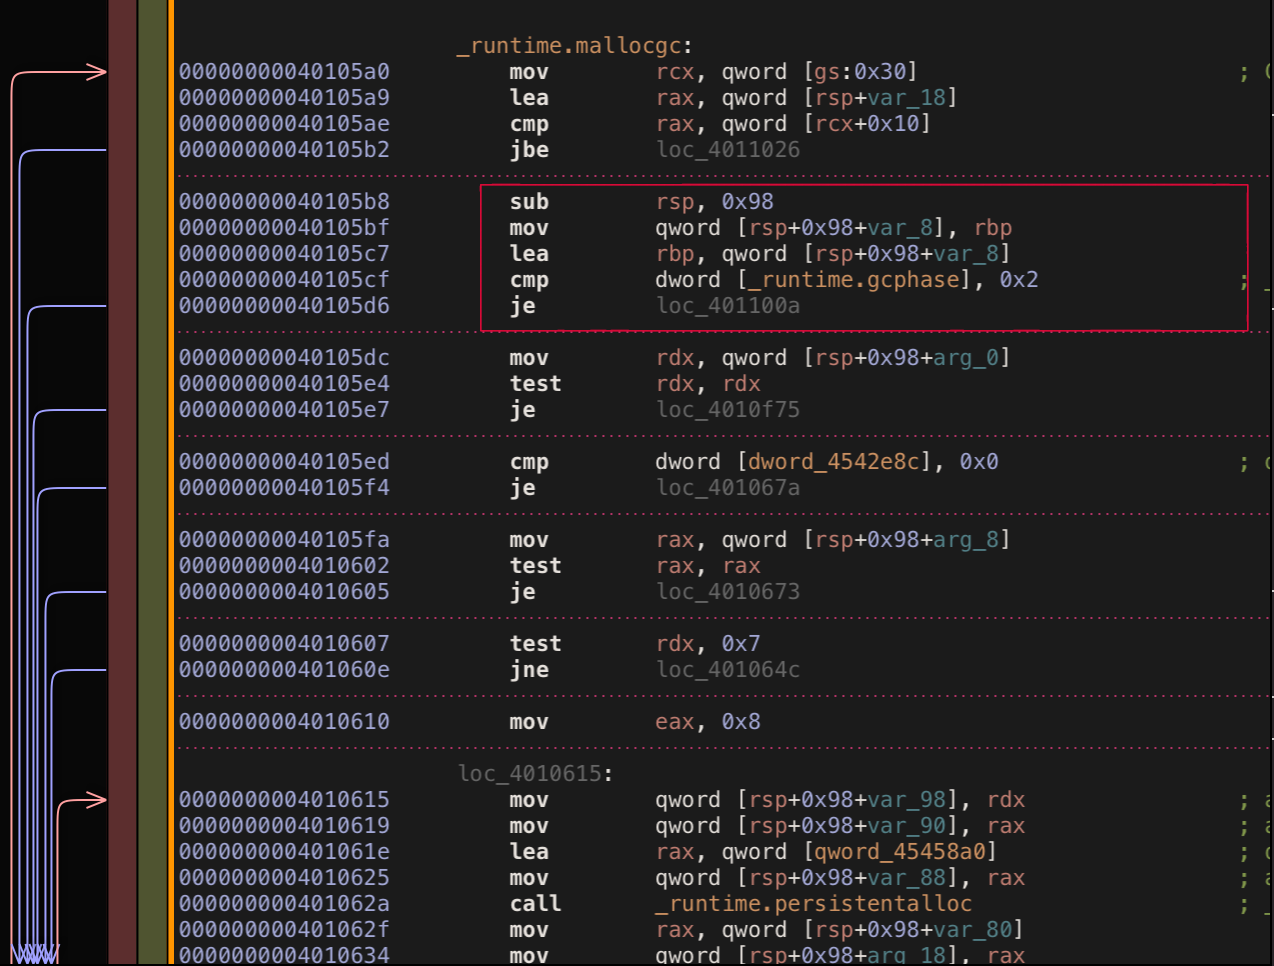
Looks like for amd64 architecture offset is 24 bytes. Let’s modify existing bouk/monkey to use this offset and try again.
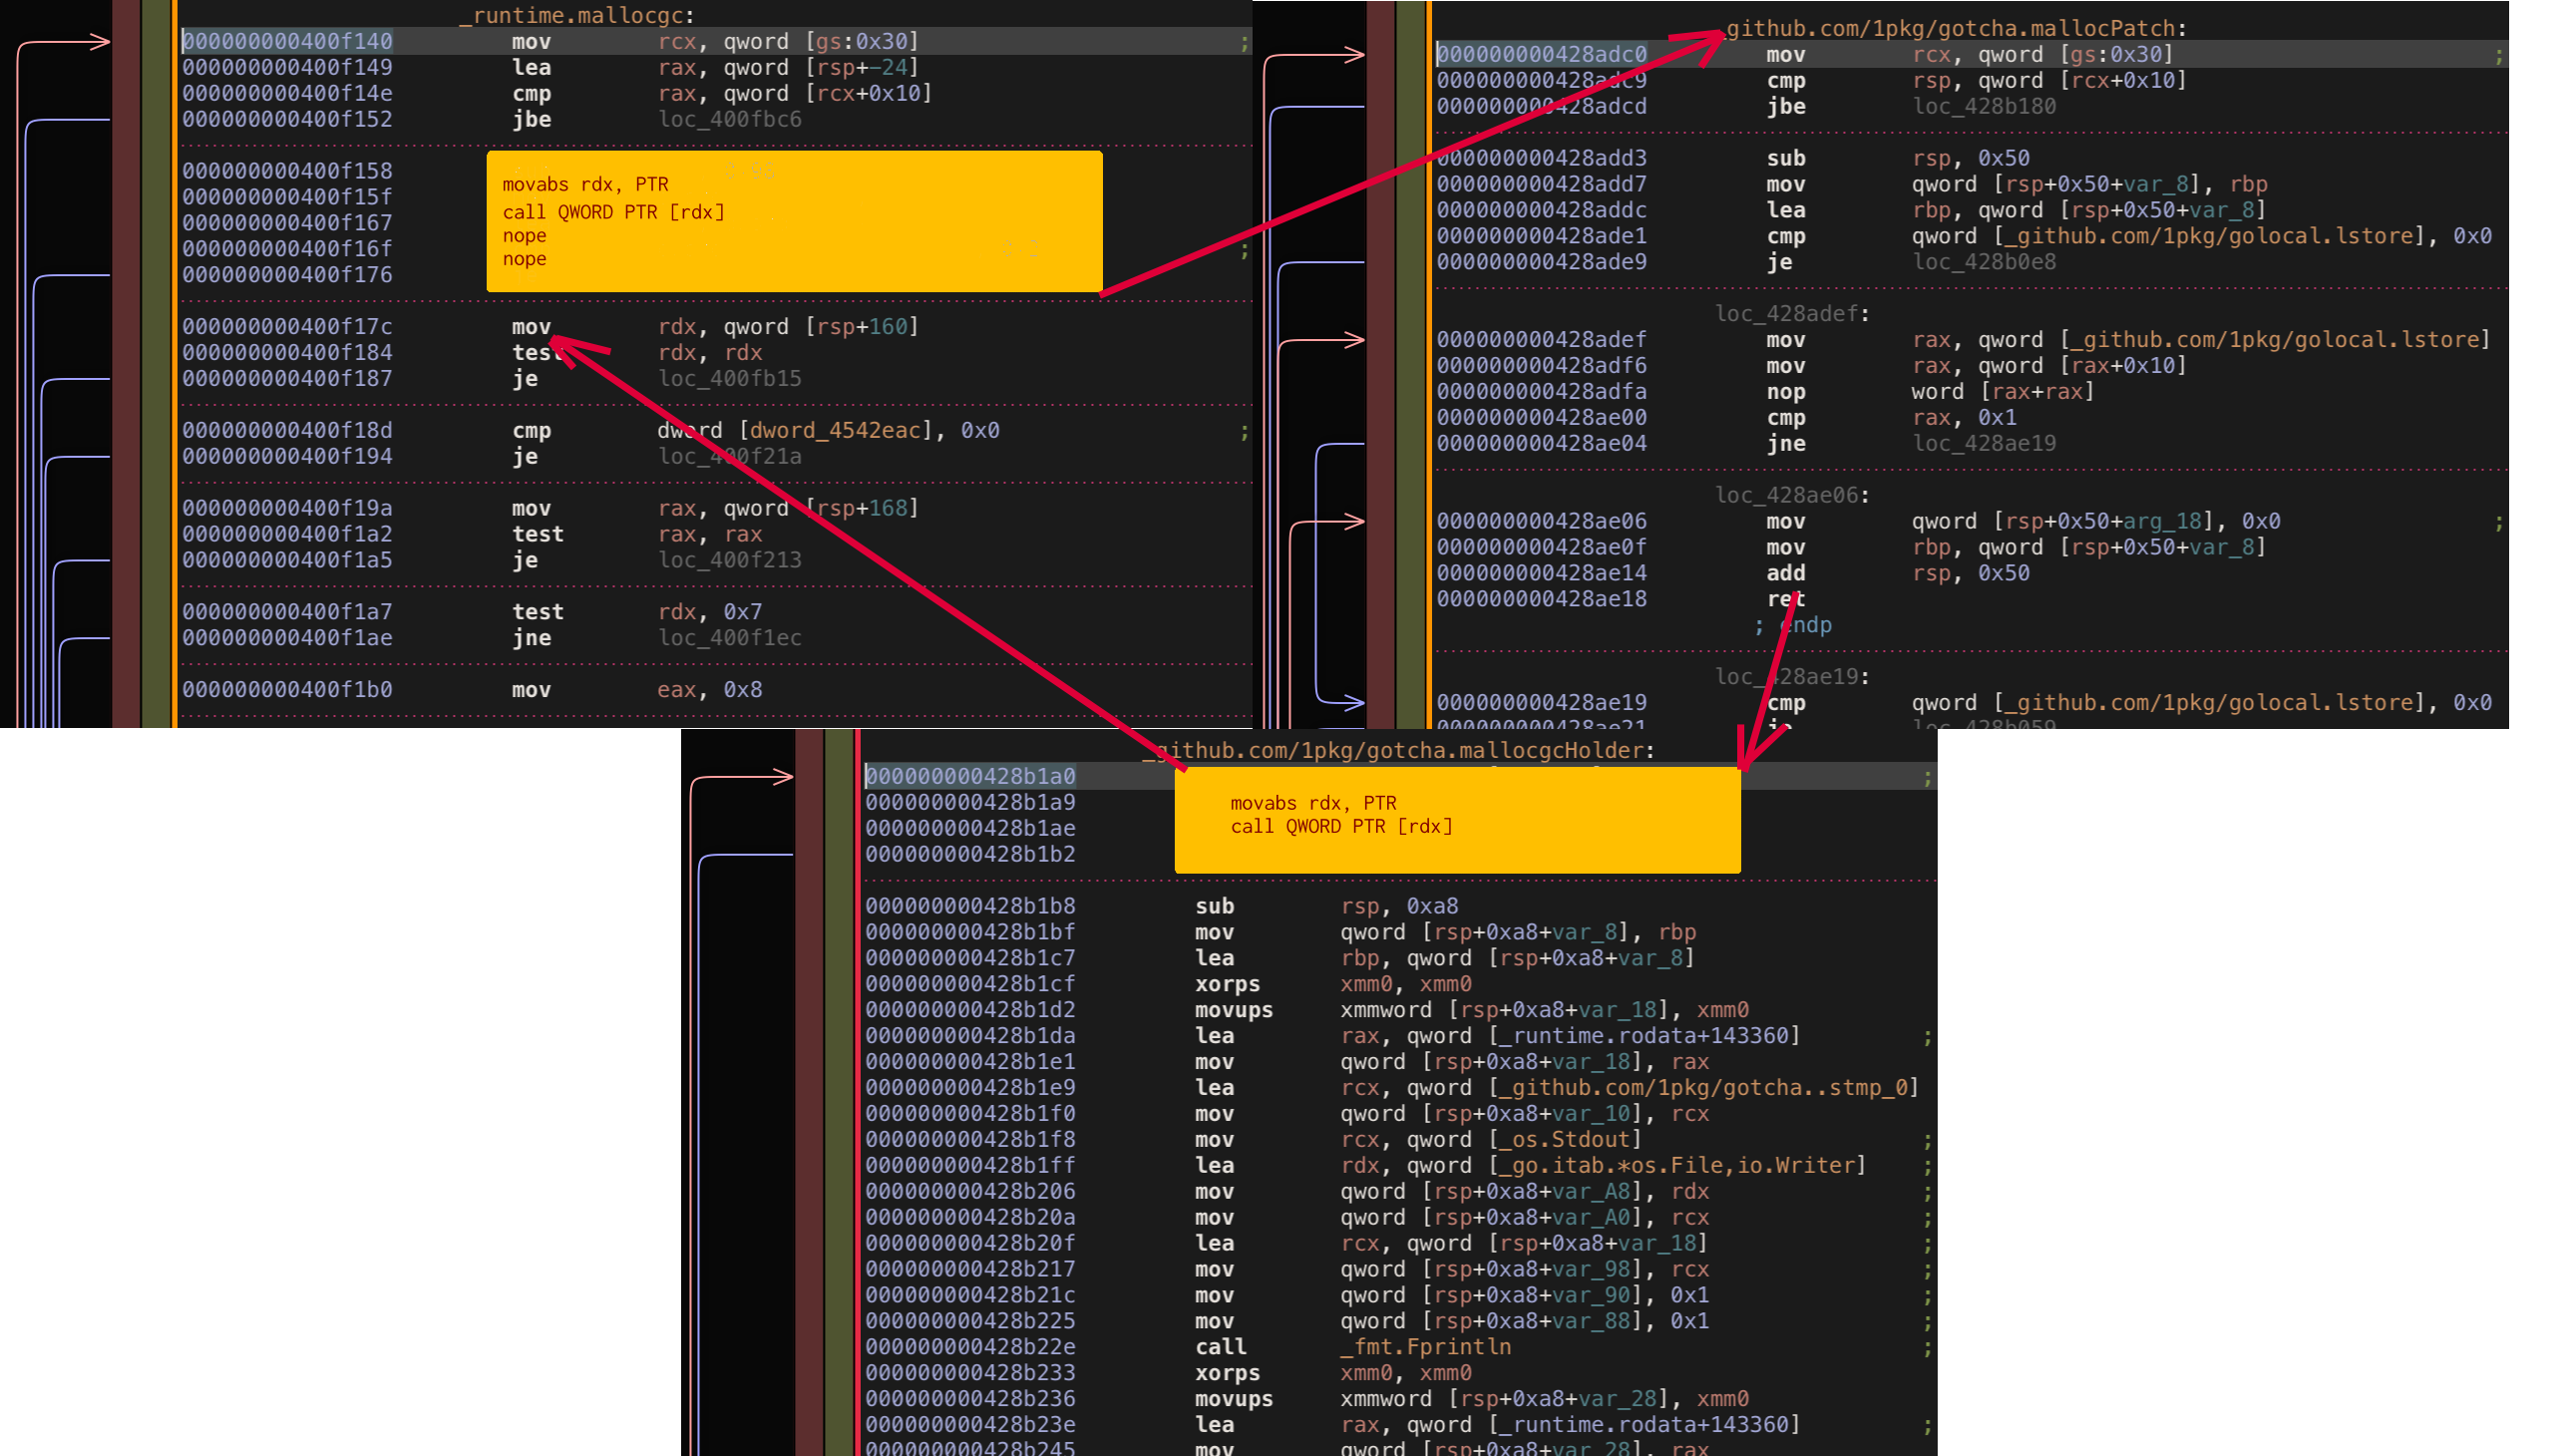
As you can expect such patching doesn’t work again. Currently, the problem is - we are patching only a part of original sacrificed if block which leaves random bytes artifacts right after patched code that can’t be executed and leading to crash. Good for us it’s easy enough to fix - what we need to pad our patch block with nop instructions to match original replaced block size.
Does it work this time? Yes, No, Not really???
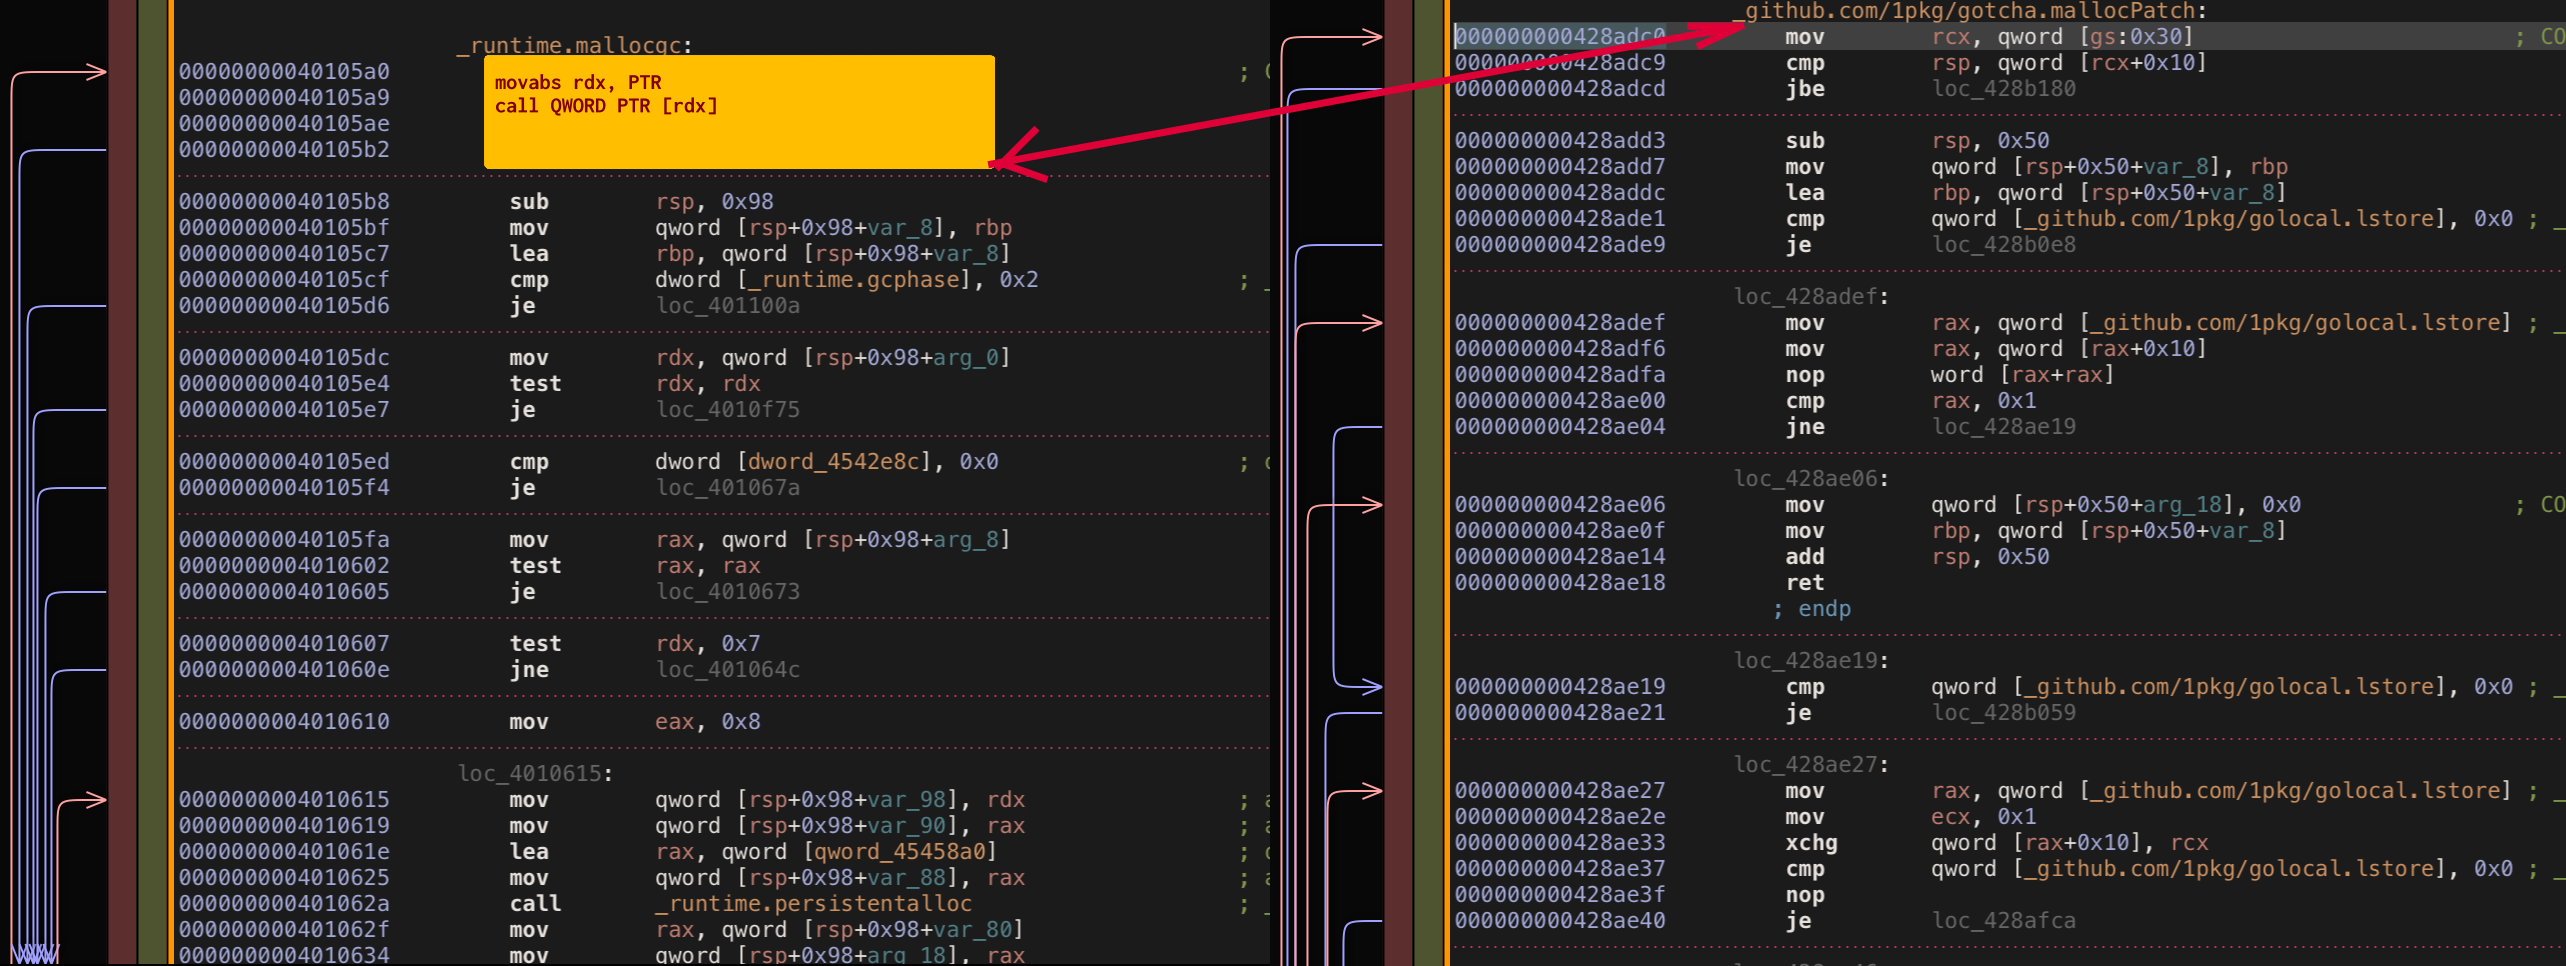
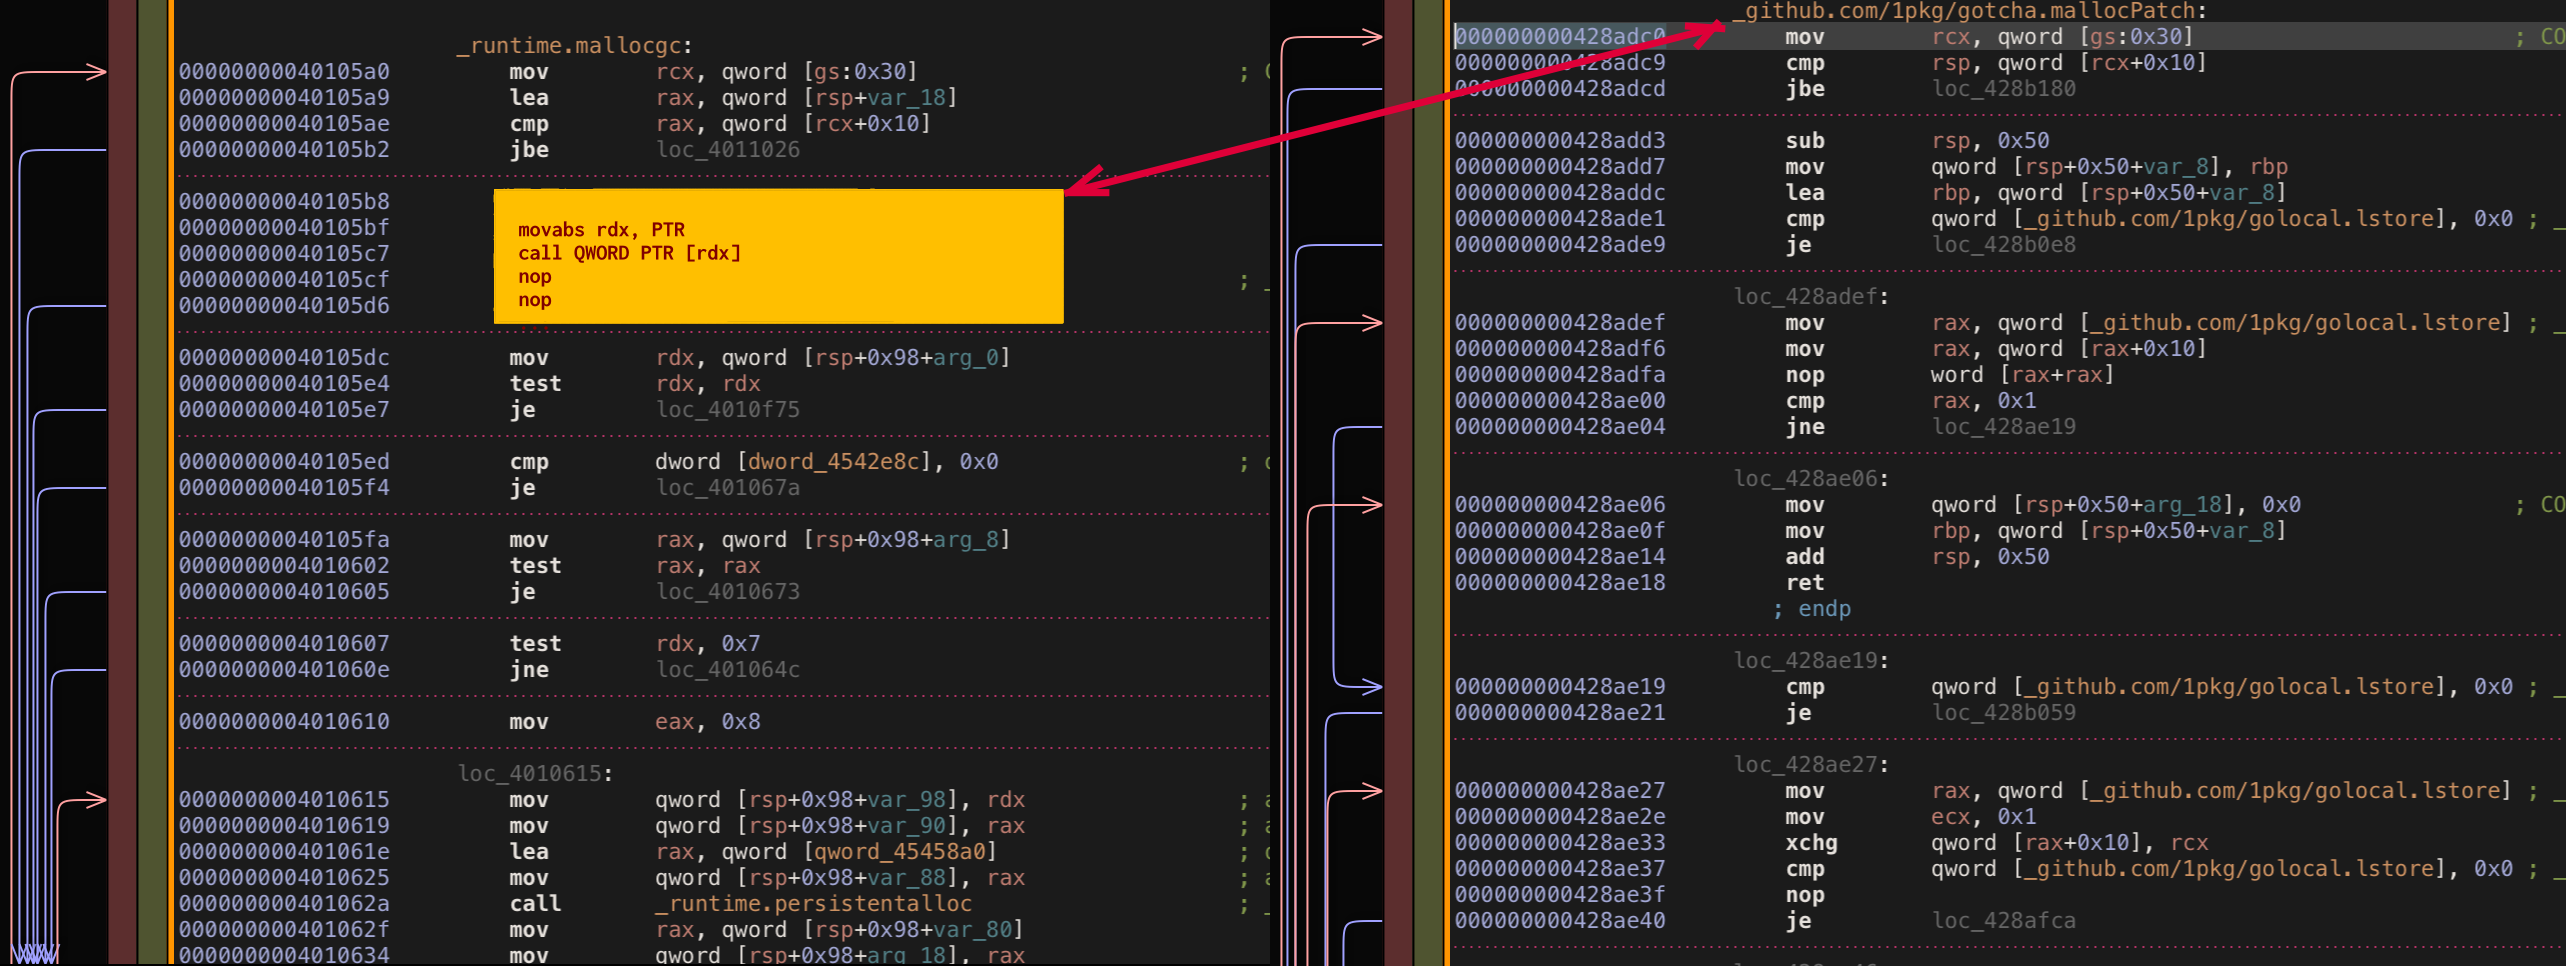
Basically with call offset pad method we’ve almost achieved desired behavior, indeed decorator patch is called first and then original mallocgc body is executed (without first if block). The only slight issue our decorator doesn’t receive proper (size uintptr, tp *tp, needzero bool) arguments. In fact it receives some sort of messed memory instead which redirects us to reading go function calling convention.
There are not a lot to say there: currently go uses stack based calling convention. There are some nice articles that gives you basic understanding of go calling convention basics #1 #2. Back to our issue in order to execute the call we need to use the calling convention, which means push the arguments to stack and update virtual stack pointer SP (the implementation for amd64 is listed bellow).
# before call
sub rsp,0x28 # allocate needed stack for call
mov rax,QWORD PTR [rsp+0x30] # load argument 1 from the stack
mov QWORD PTR [rsp],rax # push argument 1 to the stack for call
mov rax,QWORD PTR [rsp+0x38] # load argument 2 from the stack
mov QWORD PTR [rsp],rax # push argument 2 to the stack for call
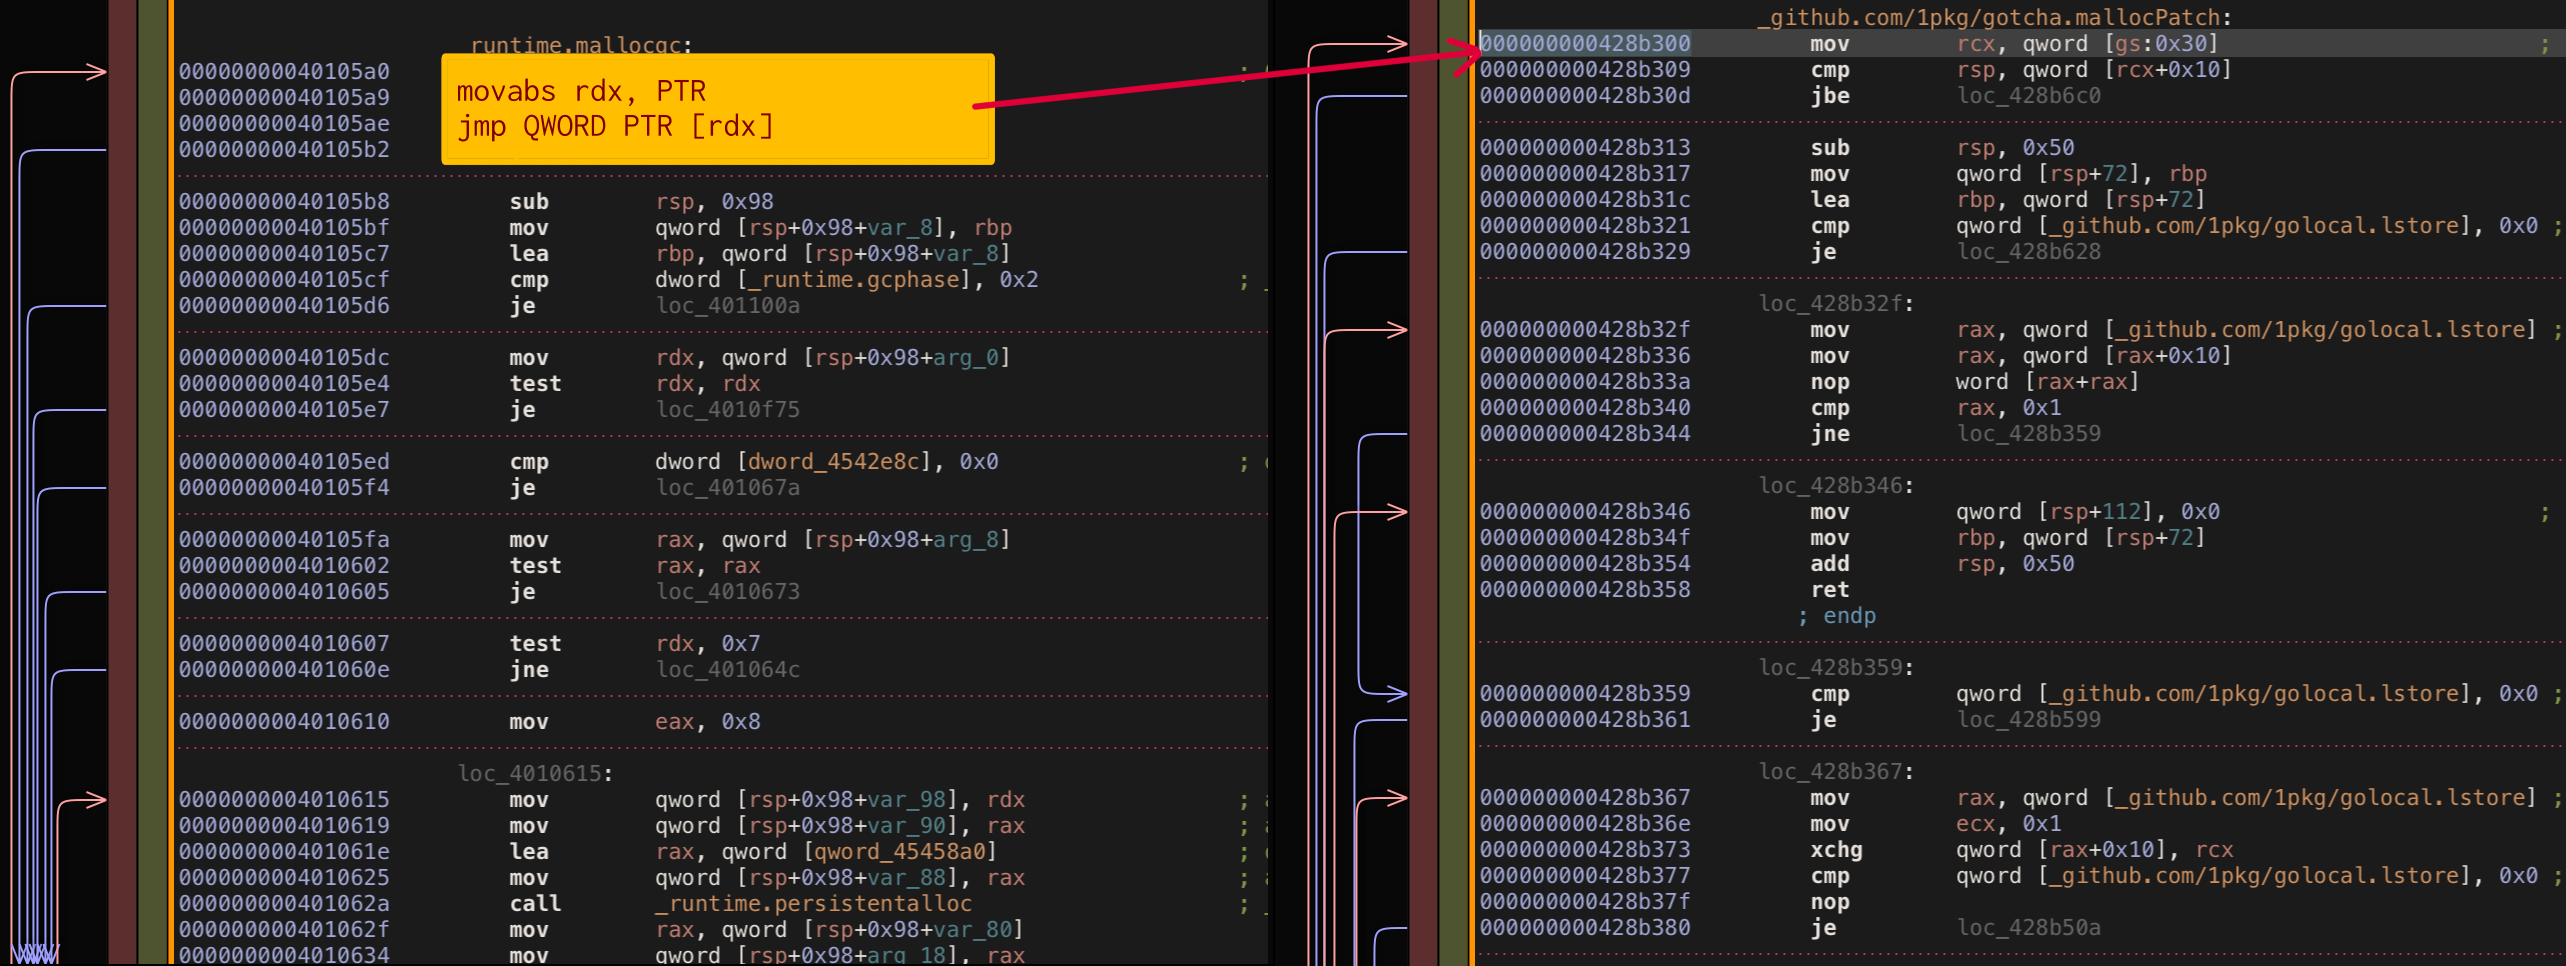
# execute call
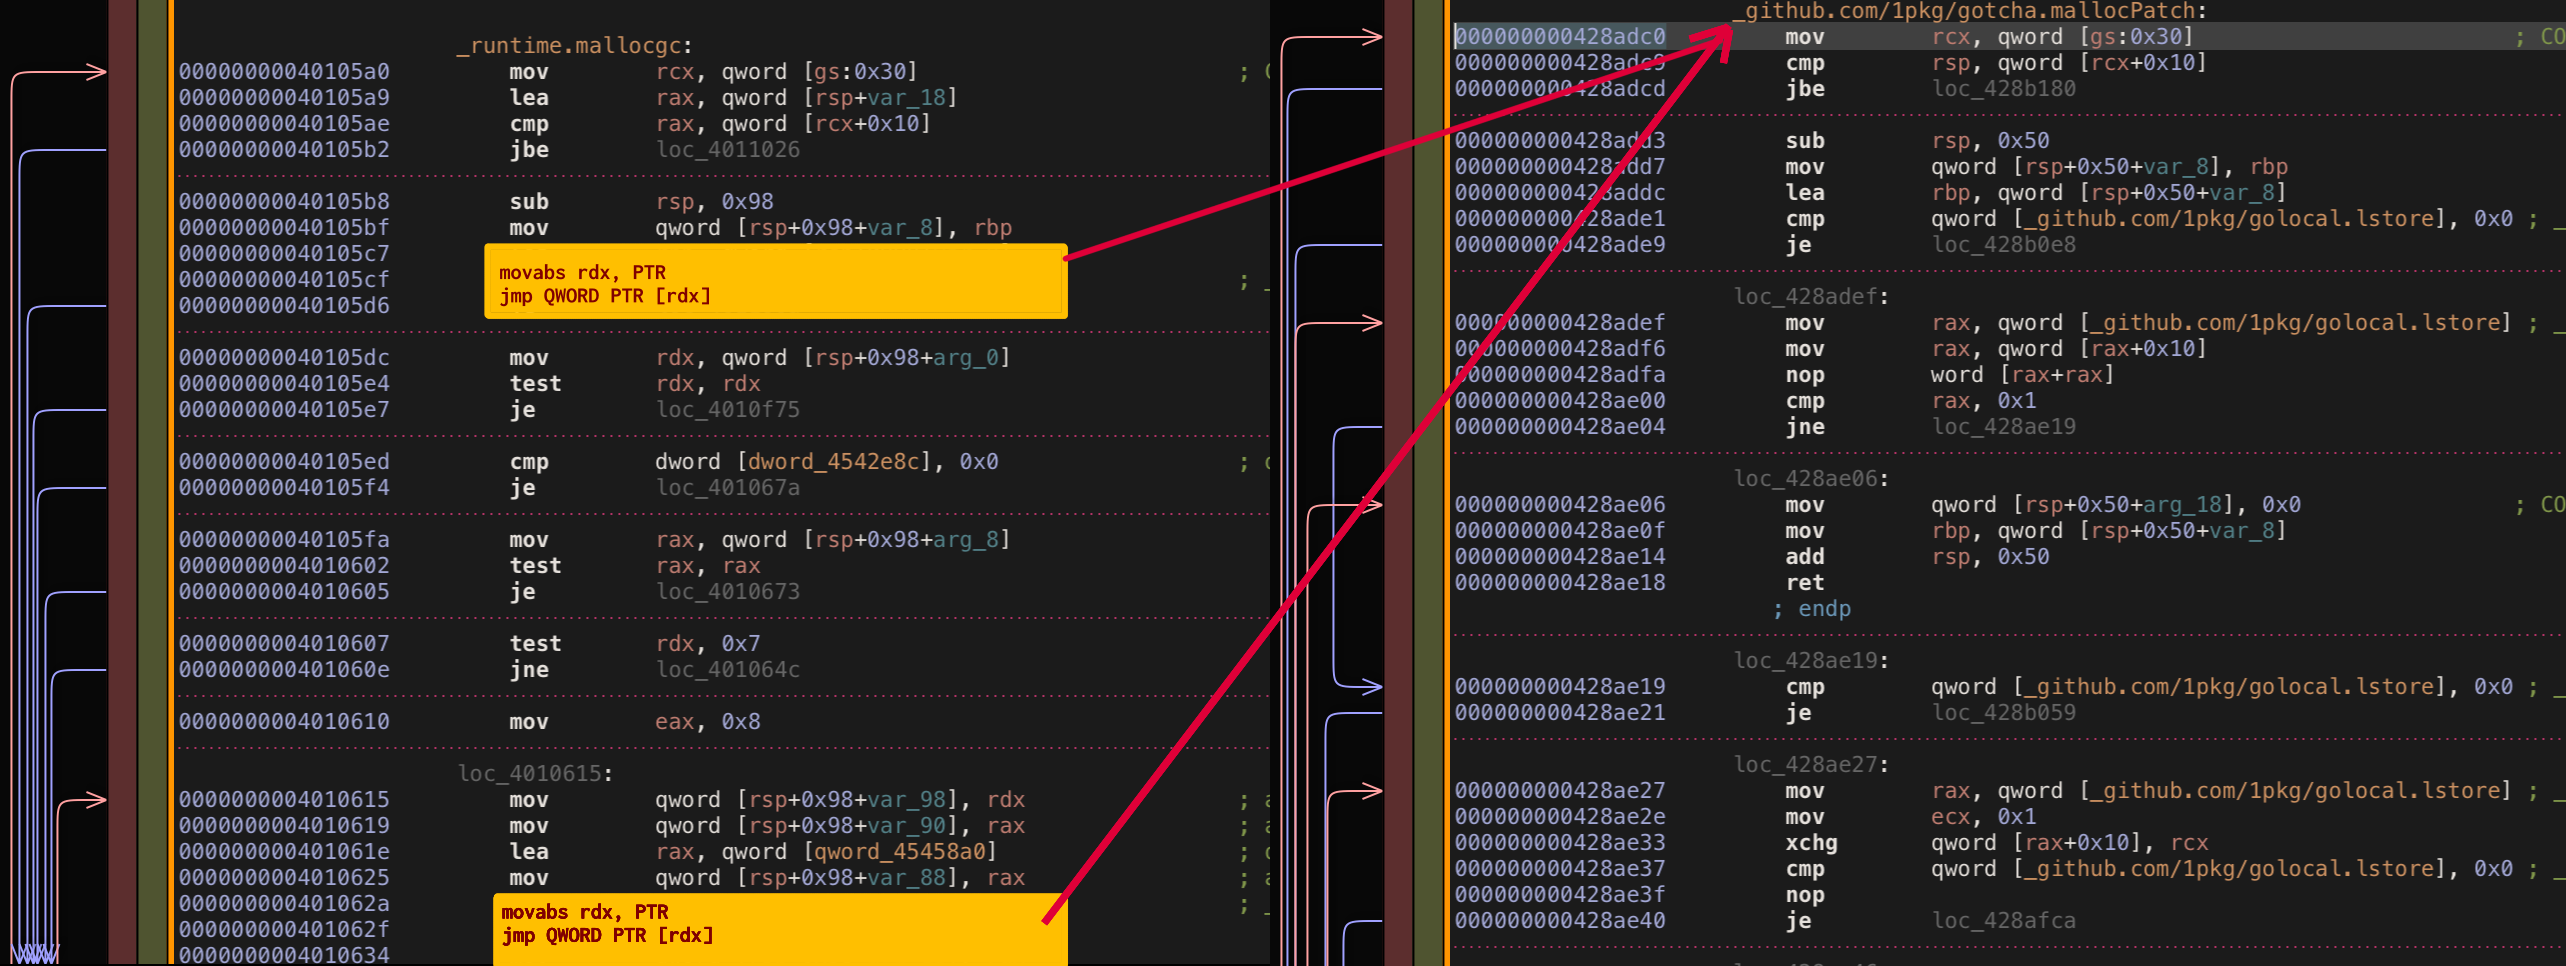
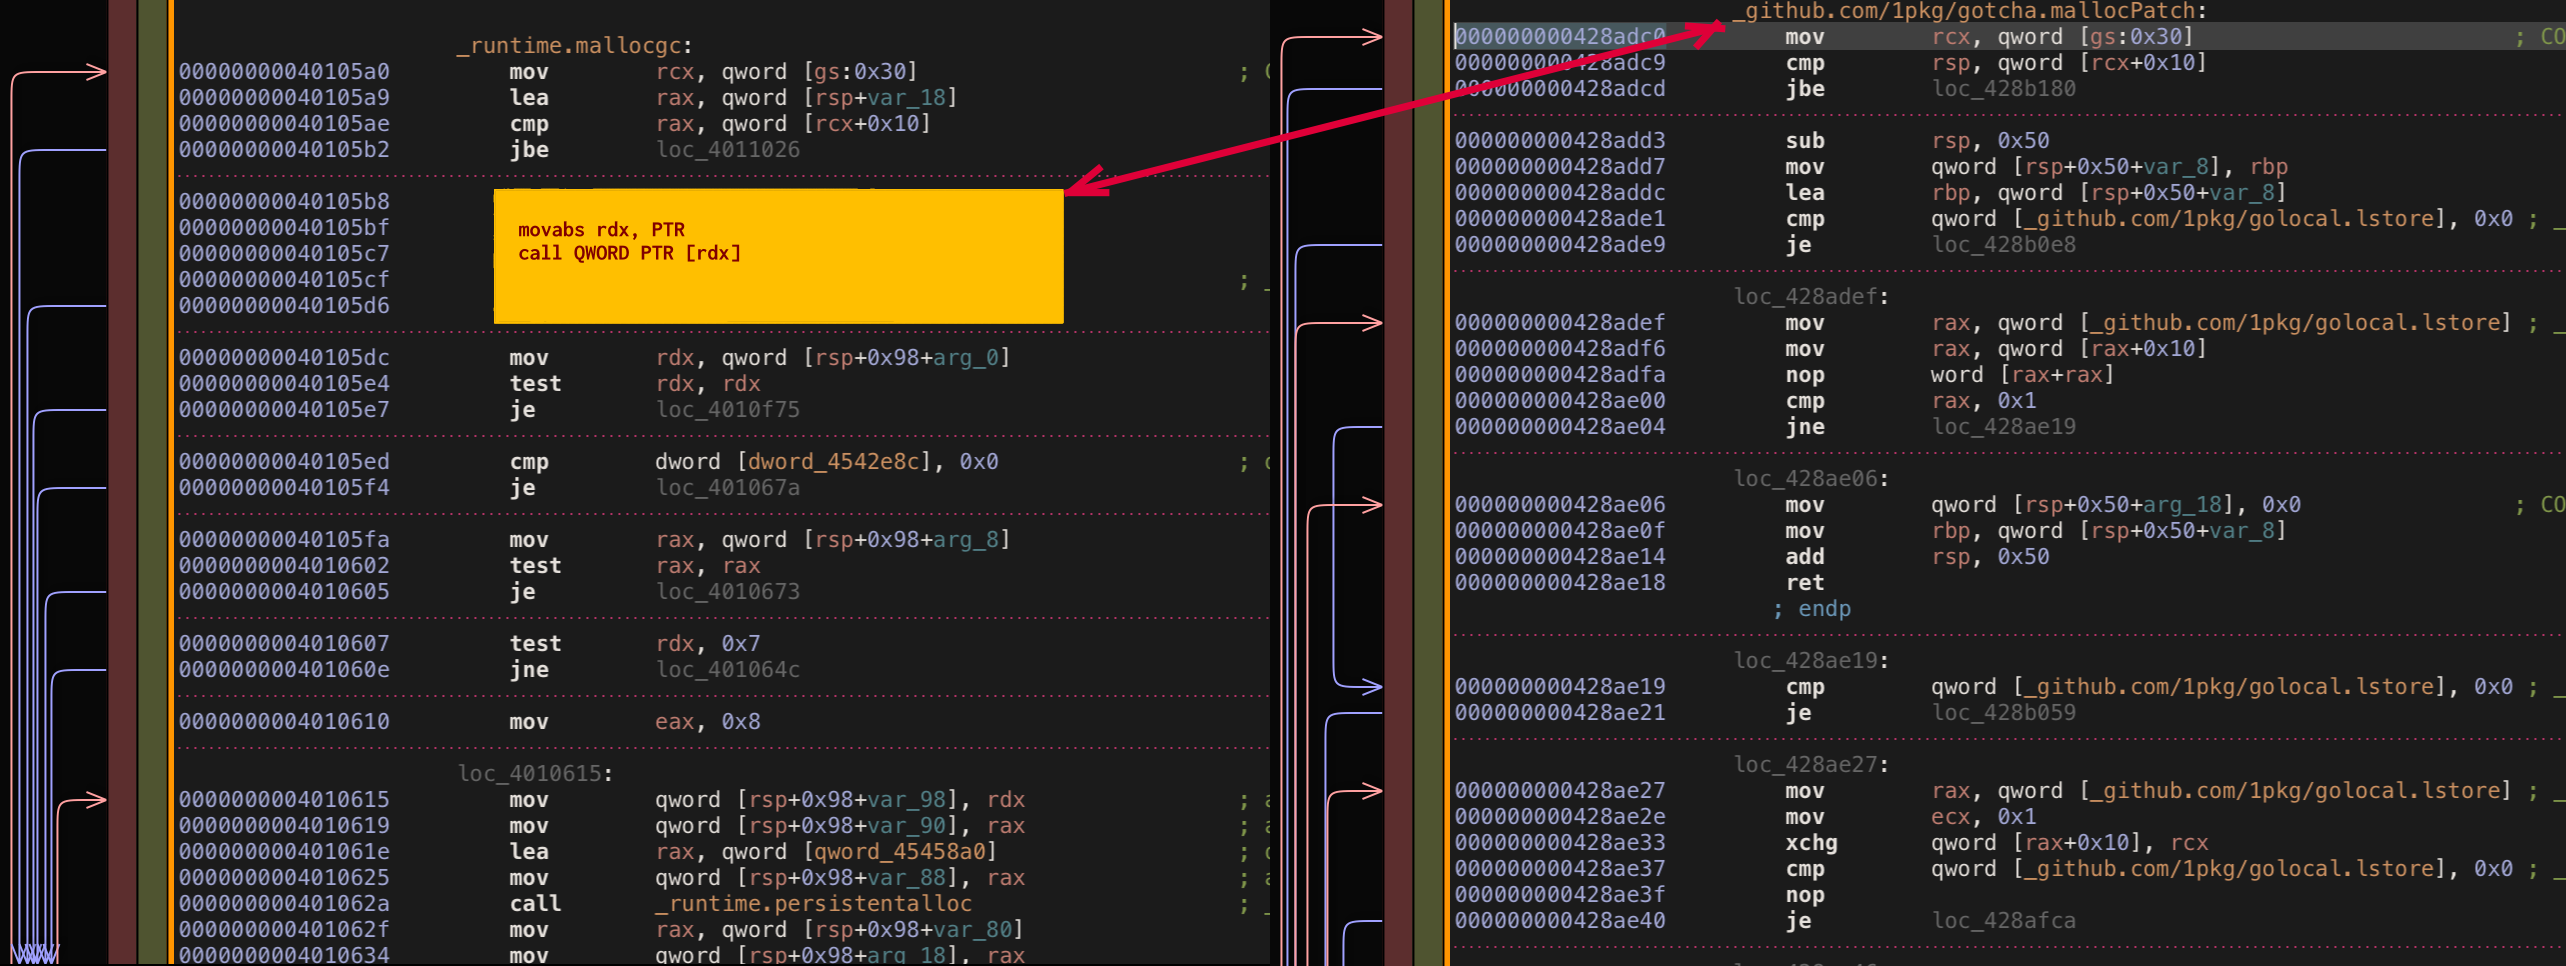
movabs rdx, PTR # load patch decorator address to call
call QWORD PTR [rdx] # call patch decorator
# after call
add rsp,0x28 # reset stack after call
sub rsp,0x98 # reset stack to initial `mallogcgc` state
This implementation translates to 46 bytes for amd64, which unfortunately means we need more original mallocgc code to be sacrificed. Back to original mallocgc implementation we will need second if guard as well as first to cover patch size.
The second check seems a bit more important than first one, although probably it just serves “fast allocation code path” and we can replace it too (anyhow we don’t have any choice). All together first check + second check give us 53 bytes which is fine for us as we need only 46 bytes.
Putting it all together and our patching started to work 🎉. I decided to put patching code to separate library 1pkg/gomonkey, there are two reasons: patching described above needed for gotcha is really drifted away from original library and bouk/monkey is no longer supported by the author anyway.
// PermanentDecorate decorates function target call
// with replacement function call by replacing
// original function starting at offset with padding assembly bytes
func PermanentDecorate(t, r interface{}, offset, padding int, before, after []byte)
Note: despite that implementation above works, it’s super unsafe. It uses code assumption about mallocgc, depends on calling convention that could be soon changed #1 #2, uses platform specific machine code direcly, etc. This implementation isn’t expected to work on anything apart from amd64 with latest go runtime. Nevertheless, you can try to use or even improve this patching implementation at your own peril!
Finally, there are more possible ideas how to implement this patching even simpler potentially. As we did with full body copping, we can use third independent function holder to store not full original body copy this time but rather the only custom jump to the place right after original patch instruction, effectively doing double jump (this way we can try to avoid stack manipulations at all).
Or we could try to replace not important parts of original function body with full patch decorator body (if we manage to make it tiny enough) instead of jump (same restrictions as with full body copy). There are also definitely many other possible methods and solutions exist but not described in this article. Finally after playing long enough with different options and tricks, I decided to stick with working yet not ideal call offset pad with stack. I don’t see any more benefits for gotcha to move forward with better patching methods for now because indeed patching is important part of the library but not its exclusive component. Also worth to mention that my poor assembly knowledge didn’t help me on this way neither so if anyone has any good idea how to improve the patching, please let me know.
Goroutine identifier - go runtime to rescue
As we need to trace current memory consumption on goroutine basis. We need to have a mechanism to get a sort of unique identifier for any traced goroutine. Then using that we can instantiate global map where goroutine identifiers stored and act as keys and tracing object as values. Then on each mallocgc call in our hook function we need to look up the global map for current tracing object, if no object is found then create new tracing object and use it, then update the tracing object with a delta of newly allocated bytes, objects, calls.
Again as with other problems, need for goroutine local storage existed long before (especially in time before context conquered the go world). There are several opensource implementations to achieve the effect - I decided to go with modern-go/gls because of nice and clean package interface. This package uses a runtime trick to obtain a pointer to the current goroutine structure runtime.g then adds specific bytes offset to this pointer to access goid identifier field. By using this package, we now can trace each goroutine memory consumption separately which is what we wanted.
However, there is an issue with using modern-go/gls directly - it allocates memory (map operations inside library). Logically enough allocations inside mallocgc will call another mallocgc which in turn will call another mallocgc which in turn … infinite loop. What we need instead to have preallocated map on startup before patching and using this bound storage instead; by tweaking modern-go/gls we end up with tiny storage package 1pkg/golocal that does single map allocation once, and works on bound storage further on (storage size could be tweaked by env variable). Also it’s utilizing single rw mutex for locking which could cause some blocked allocations!!! Not really likely though as blocking operations set and del called extremely rare compared to nonblocking get that called on each given allocation.
Final conclusion
In final conclusion we can highlight that needs of accurate memory allocation tracing exists. It doesn’t matter how good your languages tries to hide and abstract memory management, sometimes you just need to know memory consumptions and have some sort of handles to operate if memory consumption hits certain watermarks. Some of newer languages don’t provide you any direct introspective tools or they are too limited or not granular enough, go is an example of such language. So decision was made to try to provide everybody with a comfy library that helps with granular memory tracing for go.
What makes go so special in my opinion is one of its greatest merit “features and implementations conservatism” but also it strikes back sometimes - there is no straightforward way how to override core golang rules (which is overall a good thing). But as always in real life, there is at least a single exception for any given rule. Going wild with number of those exceptions go linkname code patching goroutine identifier we are able to bend the rules but not break them.
In the end final gotcha implementation has reached its goals. It traces most of the memory allocations with certain precision and somewhat idiomatic and friendly interface. On the other hand restrictions that gotcha implies make its usage simply not worth it. So I highly discourage anyone to use gotcha in any production code or maybe even any code at all as it’s extremely unsafe and not reliable and won’t be supported in foreseeable future. Nevertheless, one could probably imagine reasonable use cases for this concept library in go benchmarks or test. Finally it’s worth to say that primary intention to develop gotcha was learning and that gotcha doesn’t have comprehensive tests coverage and support and not ready for any serious use case anyway. However, I hope you enjoyed the reading and understood the main idea of this article: “despite you can adjust any generic piece to your specific needs if you try hard (especially with things that are designed in radically opposite way) it hardly worthy it in most of the cases; use specific solutions instead if you can”.